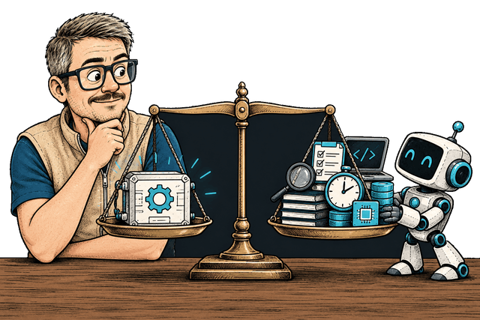
AI can reduce the marginal effort of producing an implementation, exploring an alternative, or creating a test. That does not make software free. It changes which costs dominate and which investments produce leverage.
Separate production from delivery
Code generation is one input cost. Delivery also includes problem selection, context, coordination, review, integration, release, support, and maintenance. A cheaper input can increase total cost if it produces more changes than the system can responsibly absorb.
Economic evaluation therefore needs end-to-end cycle time and outcome quality.
Find the moved constraint
When implementation accelerates, queues often appear in specification, review, security, cross-team decisions, or deployment. The correct investment is at the current constraint, not automatically in more generation capacity.
Teams should inspect wait states and rework rather than assuming where time is spent.
Renewal is a capacity too: the skills, shared understanding, and energy the current pace depends on. Improve the system before counting extra personal effort as capacity. If review delays fall because a senior engineer reviews every evening, the working-hours assumption has changed; capacity has not been demonstrated. If the team instead documents recurring requirements, strengthens independent checks, and spreads review expertise, and the gain persists within ordinary hours, the case for added capacity is stronger.
Account for option value
Lower-cost prototypes and analysis can make alternatives easier to compare before commitment. This creates value when experiments answer a decision and are cheap to discard.
Generated work becomes waste when teams keep it merely because producing it felt productive.
Exploration needs its own scorecard. An established workflow has users and operational obligations; a speculative idea may first need to show that a technical obstacle can be overcome. If both compete on near-term adoption or revenue, the established work wins by default. If exploration is exempt from scrutiny, it consumes capacity without producing understanding. Give each exploration a bounded commitment: an owner, a question, a time or spending limit, and a review point. Judge early work by the uncertainty it resolves, then move toward customer and operational measures as the evidence strengthens. An exploration that disproves a costly assumption can be worth its budget, but calling a failed attempt learning requires stating what changed.
Measure reliable outcomes
Useful measures include time to validated change, escaped defects, rework, operational load, adoption, and learning captured. They should be interpreted together and in context.
Lines of code, prompts, agent runs, and pull request counts measure activity. They do not establish customer or organizational value.
Price an accepted change
OpenAI’s AI-age scorecard similarly emphasizes useful work relative to full cost. Its guidance on connecting usage to business value separates adoption signals from outcomes and includes review, correction, setup, and support in the comparison. These are measurement principles, not evidence that every workflow produces savings.
Use a comparable task class and an explicit observation window. The following numbers are hypothetical and describe a cohort, not a forecast of AI savings. Labor is valued at an illustrative loaded rate of $100 per hour. Cash savings do not follow automatically from released salaried time.
| Cost for ten accepted changes | Existing workflow | Agent-assisted workflow |
|---|---|---|
| Definition and context | 10 hours | 14 hours |
| Implementation and supervision | 30 hours | 10 hours |
| Review and verification | 10 hours | 16 hours |
| Rework, including failed attempts | 5 hours | 8 hours |
| Total labor | 55 hours | 48 hours |
| Inference and sandbox compute | $0 incremental | $300 |
| Allocated workflow maintenance | $0 incremental | $200 |
| Total modeled cost | $5,500 | $5,300 |
| Cost per accepted change | $550 | $530 |
The comparison shows a modest difference despite a large implementation reduction. Count every attempt needed to obtain the ten accepted changes in the numerator. If difficult tasks are excluded from one cohort, disclose that selection and do not claim a general effect.
With these assumptions, two extra hours of review would erase the $200 difference. A single expensive escaped defect could reverse it. The table excludes shared baseline infrastructure and long-term defect costs from both sides; a real decision needs those costs where they differ materially.
Illustrative cost for ten accepted changes. Both bars use the same $5,500 scale.
- Labor
- Compute
- Maintenance allocation
Capacity, cash, and customer value are different outcomes
The seven labor hours released might support another experiment, reduce overload, or remain unused. They are not automatically a budget reduction. To claim customer value, observe adoption or the operational result the change was intended to produce.
In the fictional Northstar case, preventing duplicate order behavior matters more than the number of retry-related pull requests. The sandbox can establish a behavior improvement under test. It cannot establish production incident reduction before production evidence exists.
A strong week is not a new baseline
Released capacity raises a planning question: how much should the team now commit to? Three quantities answer it, and they are easy to merge.
| Quantity | What it describes |
|---|---|
| Observed velocity | The accepted progress the team is making in the current window |
| Sustainable capacity | The rate the current system can hold under ordinary variation |
| Chosen operating pace | The rate the team commits to, given priorities, risk, and other claims |
A strong week establishes a strong week. Sustainable capacity needs evidence that the rate holds when someone is away, an incident arrives, or the work is unfamiliar. Even then, the operating pace is a decision. Some capacity may go to reliability, exploration, or slack, and that choice should be explicit rather than absorbed into a higher expectation. The source essay, The Maximum Velocity of a Team, develops these distinctions.
Watch the queue
Read customer ROI claims with the same distinctions. OpenAI’s 1Password case study estimates engineering capacity value using stated assumptions about attribution and productive use of saved time. It is a vendor-published customer example, not a randomized estimate or a guarantee of cash savings. Use it to examine a measurement method, then populate that method with your own evidence.
Suppose generation supplies four reviewable changes a day and the team can verify two. The unfinished queue grows by roughly two changes each day if nothing else changes. Increasing generation is then a poor investment unless there is a valuable reason to stockpile work.
Measure elapsed time from accepted intent to trusted result, alongside active effort. Define the start and end explicitly. Track median and tail waits when the sample supports them, plus rework and escaped defects over a stated window. Avoid collapsing all of that into one score.
Two further measures show whether the pace is borrowed. Record human intervention effort with its reasons, so recurring causes become candidates for better context or checks. Track workload and knowledge concentration: if throughput depends on recurring overload or on one person who resolves every compatibility question, the system is more fragile than its delivery numbers suggest.
Decide what not to build
For each proposed experiment, name the decision it will inform, the cheapest useful evidence, and a stopping condition. A prototype is valuable if it resolves uncertainty; keeping it because it was easy to generate adds future maintenance without establishing demand.
Create this table for one task class using your own observed figures. Include a sensitivity case with twice the review effort and no assumed adoption benefit. If the decision survives only optimistic assumptions, narrow the pilot before scaling it.